LS Staging

Tag: google analytics

  • User Explorer from Google Analytics Get detailed insights on your website or app user at an individual level

    User Explorer from Google Analytics Get detailed insights on your website or app user at an individual level

    Google Analytics @LogicserveDigi

    If you are using any of the marketing automation platforms or customer analytics tools like Hubspot, Pardot, Marketo, Eloqua, Kissmetrics or Mixpanel, to know the individual user behaviour on your website or mobile app, you may now want to use Google Analytics’ latest feature called the ‘User Explorer’ report instead. As the name suggests, the report provides detailed insights into an individual user’s activity on your website or the mobile app, as against the aggregate user behaviour that Google Analytics used to provide so far.  This extremely useful feature from Google is now out on beta, and is available under the ‘Audience’ menu in the Google Analytics view of your website or mobile app.

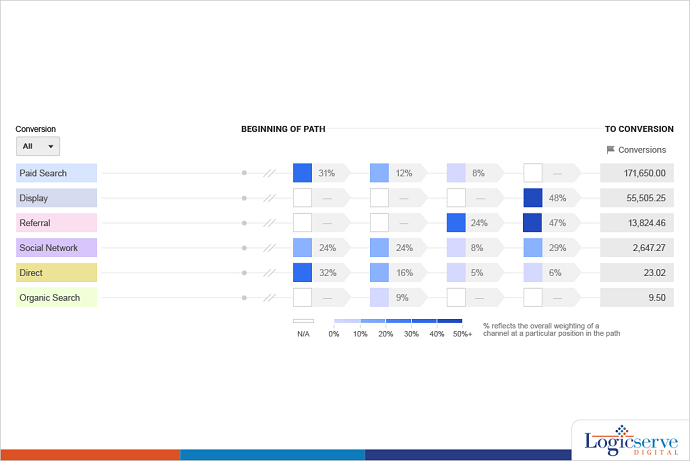
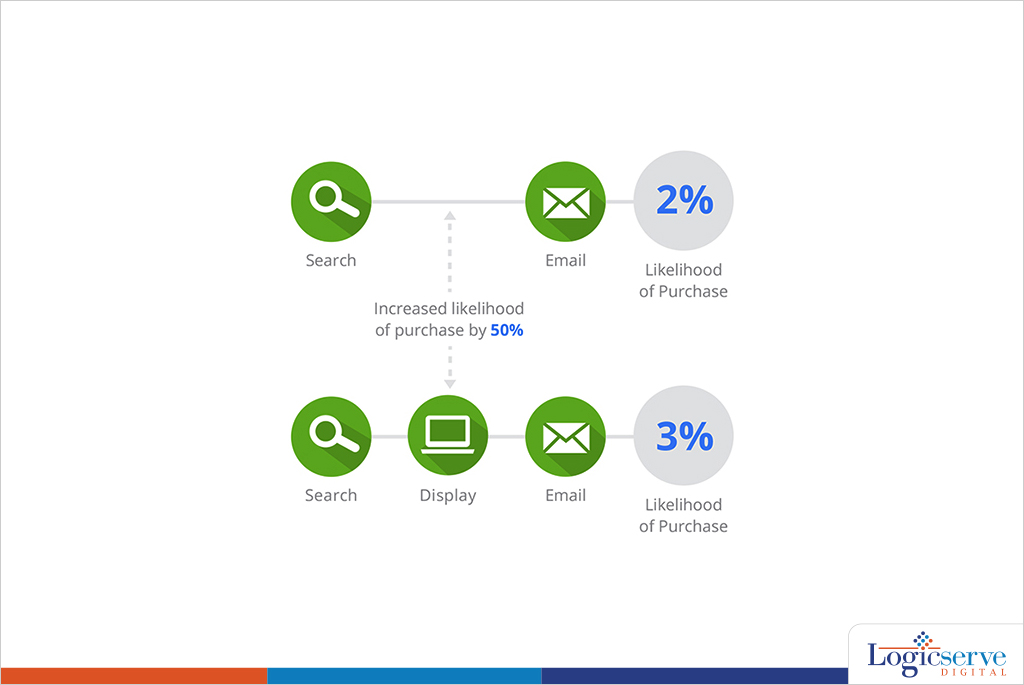
    This feature will allow marketers to understand the entire user journey and the actions taken before reaching a desired outcome. It can also help them re-engage anonymous individual customers who have not converted, through existing marketing channels. Especially for the e-commerce sites, the report can provide post-purchase behaviour of an individual customer, like the frequency of return visits and purchases, thus enabling the e-commerce players to calculate an individual customer’s lifetime value.

    What can you get from the User Explorer report?

    Overall User Analysis

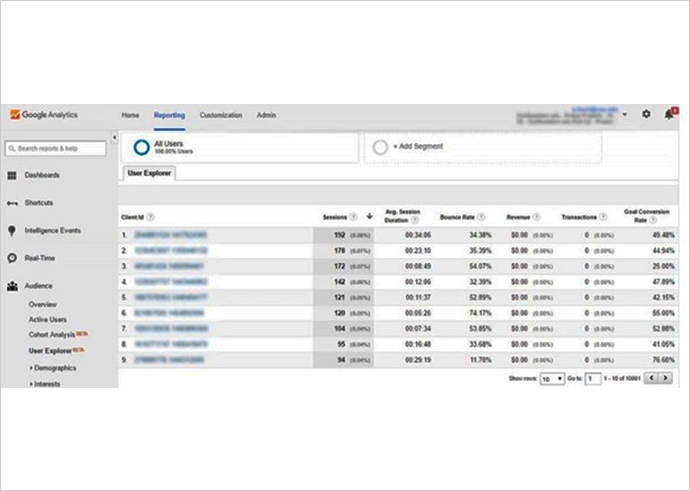
    To begin with, the default User Explorer page displays a list of client IDs collected from visitors’ devices and browsers with basic data, including count of sessions during the selected time period, average session duration, bounce rate, revenue, transactions and goal conversion rates. You can sort this list on each of these metrics, to answer questions like ‘who have visited the most often’, ‘who have spent the most time’, ‘who have had the highest no. of transactions’ or ‘who have the highest goal conversion rate’.

    user explorer google analytics @LogicserveDigi

    Multisession User Analysis

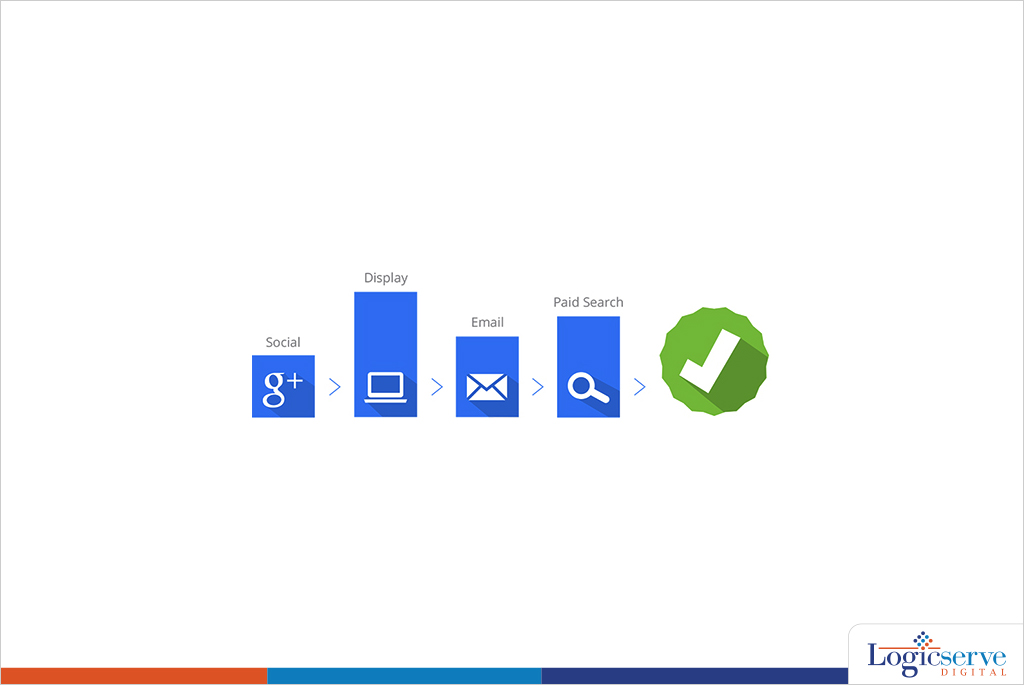
    This is where the feature adds significant value. Clicking on any of these client IDs provides the detailed analysis at an individual level, where the report displays a user’s activity in a timeline view, with key facts like the user’s acquisition date, acquisition channel, device type, and their custom dimensions. The user interactions in this view can be filtered by Pageview, Appview (available only in mobile app views), Goal, E-commerce or Event, and individual activities can be clicked for additional details.

    Google analytics news @LogicserveDigi

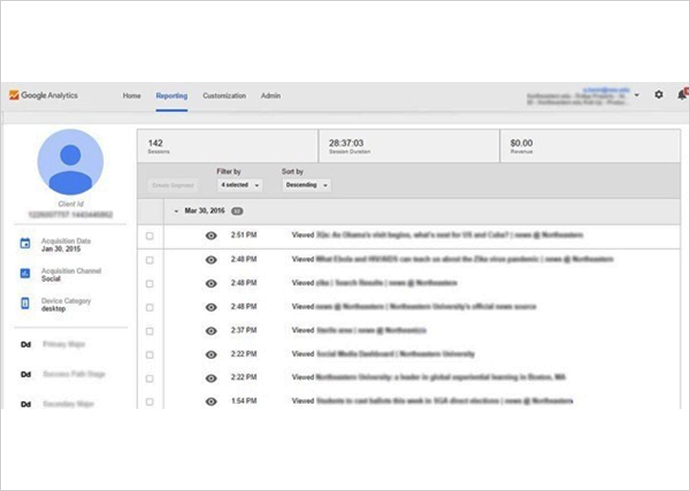
    The client IDs are randomly generated by Google Analytics, and thus, are completely anonymous. Though these IDs persist across multiple sessions, they change if the user changes the device or the browser to access your website or app. You can get cross-device and cross-browser user tracking, by enabling user authentication systems (like user logins) on your website or app.

    User Segmentation

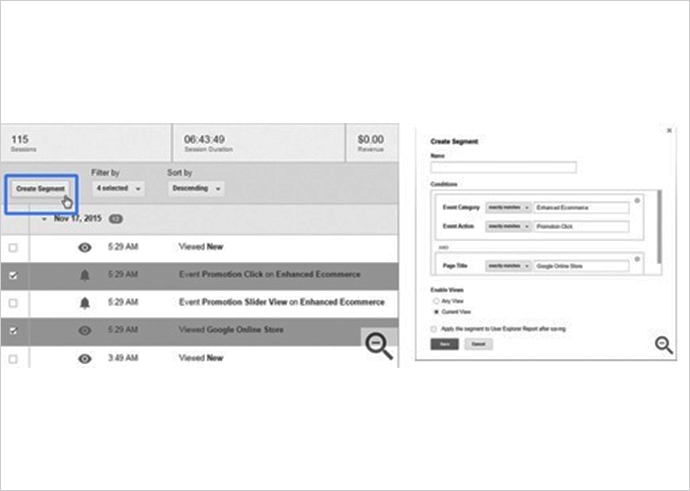
    You may be using Google Analytics user segments already, through Cohort Analysis, to study specific types of visitors, but User Explorer takes this one step further. By clicking on a combination of actions that a specific user engaged in (a certain page visit, an event triggered, specific value generated), you can create a user segment which, if applied to the entire report, will allow you to extract similar users in your audience. This will let you see how a particular user segment behaves across your site or app. You can also re-market specifically to customers of this segment.

    google analysitcs news @LogicserveDigi

    How to get the most out of your User Explorer report?

    To get the most out of this feature by Google Analytics, make sure you do the following:

    • Add “short of purchase” as a value to your goals to help you identify users close to being your customers
    • Filter out the staff and agency visits from your reports, using a filtered view
    • Create and use segments to understand different types of visitors: loyal fans, fast shoppers, international customers, anxious online shoppers, job seekers, information hunters, lowest price buyers
    • Add user authentication systems like user logins to your sites and apps to enable cross-device and cross-browser multi-session analysis


    You can imagine how useful this new feature from Google Analytics will be, right from identifying your most valuable customers, their behaviour before they reach a desired outcome, to cross-device user journeys in response to your marketing campaigns, thus knowing their effectiveness, to establishing best practices to re-market specific user segments. The User Explorer report can also help you trace inconsistencies in the UX and UI design of your website or app, based on the user experience, which can then be improved to drive higher conversions. All in all, the User Explorer report from Google Analytics can be your next starting point to build amazing experiences for your customers.

  • Tips to Gain Insights from Google Analytics and Optimize Your Site Better

    Tips to Gain Insights from Google Analytics and Optimize Your Site Better

    Optimize Your Site with Google Analytics
    Optimize Your Site with Google Analytics

    Have that niggling feeling of your site not performing well because of your content? Seek out a firsthand report offered by Google Analytics reveals the areas of improvement within your website along with drawing your attention on crucial parameters which you could have unknowingly ignored. Developed by world’s preferred search engine company, Google Analytics is a tool that offers an extensive range of analytics reports for you to infer from beginning with:

    • Site Analysis
    • Multi faceted Approach
    • Visitor analysis

    Discussing these parameters in detail –


    Site Analysis

    Once you are at Google Analytics, proceed to the sections titled Behaviour and Site Content that will highlight some of the crucial site visit parameters viz. page views, unique page views, time spent on page, bounce rates, even page exits. The analytics can make you understand what your visitors were looking out for on your site.

    Check out the Site Search feature which reveals the most searched items for, the terms and queries which lead to conversions and those which have lead to exits. Also, you need to figure out the reason of non conversion by studying at which url, the customer left the site. Are there any corrective measures that could be implemented? Also, the next imperative action would be to seek out how to make your content more compelling

    Work around your website intelligently and improvise it by adding engaging content in form of quality quotes, images and content. Spruce it up by adding testimonials, evidence, videos and much more. On the overall, you require to fortify the trust of the visitor/customer in you and your business upon their visit to the website. Similarly, pay equal attention to the site navigation and user interface

    As Andy Crestodina of Content Marketing Institute states, it is essential to know what and which and type of content is preferred by the visitors to your site. And you need to narrow down the gap between the two and make your website deliver a well optimized performance.


    Multi faceted Approach

    You must be aware that your website enjoys traffic through multiple channels – tablets, laptops, smart phones and etc. Apart from being mobile friendly, you need to understand from where the traffic is flowing into especially at which stage – research, decision stage or the conversion stage. On similar counts, it is essential for you to analyze the preferred search engine of the visitors – Safari, Android, Chrome to name a few

    Craig Sullivan is of the opinion that a conversion report displaying the browser and device split works out well for his analysis. Look out for browser related issues such as display issue, and if your website does not work well in any of the preferred browsers, you know what you need to do next.


    Visitor analysis

    Another key parameter is to filter through the traffic demographics and analyze. The data could reveal change in preferences on account of changes in age group, habit preferences, etc. This could be the reason why the traffic is not getting converted. Also, look out from which url, they are exiting from your website – landing page, product page, half filled shopping cart and so on. Once these critical issues are identified and resolved, your website could be performing just great.

    Tim Ash believes in delving into niche areas of the Google Analytics report and uncover insights that offer subtle hints on how to optimize the as per behavioral preferences. Here, you can figure out whether there is user experience flaw or the visitor gets disinterested in case of site loading issues across the mobile platform.

    Another report of great help could be conversion reports that include indexes of first and assisted and multi channel conversion. These reports are available by default and display in depth data related to behaviour, acquisition and even conversion, side by side.

    As Judah Phillips has noted that last click metrics are displayed as default in Google Analytics but in most cases, conversions could have happened at the top of the funnel or the bottom of the funnel. He opines that affiliate traffic will be registered at the bottom of the funnel while display advertising will be highlighted at the top of the funnel. Along with this data, analytic experts need to correlate the liner conversion metrics within the multichannel approach when evaluating a media plan.

    As a website owner, your aim should be to offer a responsive site that connects better with its visitors especially within the emerging landscapes. And, its performance within the social media network, if integrated.

    Also, you need to not only create compelling content but have a content calendar that helps you to stay on track to promote and share content on regular basis.

    Google Analytics Data does provide sufficient insights on how to optimize websites and make them perform optimally. A few clicks and you have at hand, multi faceted data which has to be carefully evaluated and analyzed to gain insights that enhance your website performance in the desired manner.


    LogicSpeak:

    Ensure that your website looks well maintained and updated always. Improve your website’s performance through Google Analytics that offers a varied range of reports. Seeking insights from these reports is extremely crucial for site improvements and enhancing its efficiency quotient does rely on them.

  • Data Driven Attribution: A Google Analytics Premium Feature

    Data Driven Attribution @LogicserveDigi

    How many times have your marketing campaign simply failed because regardless of the effort you put into it, you just can’t track when and where your customers click the exit button? Now, you finally have a respite as digital marketing might as well take a new turn.
     

    What Is Data Driven Attribution?

    You may be wondering as to what is this term and why has it generated so much hype. We are here to talk about it.

    Data driven attribution is a model which actually charts the whole journey of a customer and helps you trace the end point as to whether the customer ended up making a purchase or did he/she fail to make the conversion.

    This modeling method has been computed after careful consideration of too many parameters that influence the buying decision of a customer. We are all aware that more than one factor comes into play when you are looking to generate the right leads from your business and convert them to sales.

    With this model, you will be able to get a much better and clearer insight into which keywords are performing better; which channels seem to be offering better dividends and other sales points that have been offering you the best output you could have asked for.

    Google analytics tool @LogicserveDigi

    Now that you have some idea of what the data driven attribution model is all about, we will talk about the reasons you should use it too.
     

    Why Data Driven Attribution?

    Data driven @LogicserveDigi

    There are plenty of different reasons which will offer you the right incentives for using this model. We are going to talk of those which will get you interested.

    • Increased transparency: one of the key reasons is that this model is going to offer you much larger transparency and you will be able to get a better idea of the methods that are offering the results. Often, when you carry out digital marketing, you use a blend of multiple methods and we fail to see which method is good enough and the ones that are useless. With this method and better data output, you can get a clear picture of the channels you should tap more as compared to others.
    • Improved decision making capability: when you are taking marketing decisions, it becomes important to be sure that you are blessed with the right decision making capabilities. With this tool, you will have a much better picture of how your conversion rate is working. Thus, it improves the ease with which you can come to the right decision.
    • Easy to integrate: marketing and business requires more than one tool for operation. With data driven attribution model, you will find integration with other leading Google tools like YouTube and AdWords is not going to be difficult. This model has been designed to offer you easy integration.

    Aren’t these enough incentives to try out this model? You will be able to get the actual numbers, percentages and the sequential flow of the precise points which the customers are following from start till the end of their navigation cycle. It might end up making all the difference to your business!

  • How To Use Advanced Segments In Google Analytics

    How To Use Advanced Segments In Google Analytics

    Advanced Segments in Google Analytics become essential tools if you wish to gain deep insights into visitor behavior. With Advanced Segments, you can go way beyond what is available by default from GA.

    Benefits of Advanced Segments

    Here are a few questions that Advanced Segments will help answer:

    • How the website visitors are geographically distributed over time?
    • How many visitors use mobile devices to visit the website?
    • What are the demographic characteristics of website visitors?

    Of course, you will get answers to many more questions too, depending on how you use Advanced Segments.

    So what should Advanced Segments for Google Analytics be used for? Well, here are a few suggested segments that you should definitely use:

    • Segmentation by Referrer/Traffic Source
    • Segmentation by Visitor Type
    • Segmentation by Visitor Action
    • Segmentation by Value

    Of course, these are only a few of the suggested segments — there are many more depending on your unique requirements.

    How to Use Advanced Segments

    Let us see how to create and then turn on an advanced segment.

    • With the Reporting tab highlighted on the Google Analytics web page, click on the down arrow as shown in Pic 1.

    Advanced-analytics-segment-1           (Pic 1)

    • From the resulting drop down menu, click on the “+ Create New Segment” button as shown in Pic 2.

    Advanced-analytics-segment-2(Pic 2)

    • Give a name to your segment by typing it into the “Segment Name” box as shown in Pic 3.

    Advanced-analytics-segment-3(Pic 3)

    • We have named this segment “Test Segment”. You have to decide the metrics on which you want to segment the traffic. For example, you can segment by the conditions of a visit. To do this, click on the Conditions button as shown in Pic 4.

    Advanced-analytics-segment-4(Pic 4)

    • You can make the appropriate choices in the Source and contains drop down menus as shown in Pic 5 and Pic 6 respectively.

    Advanced-analytics-segment-5(Pic 5)

    Advanced-analytics-segment-6(Pic 6)

    After you have set the appropriate values, you can click on the Save button to save the segment.

    When you click on the down arrow again as shown in Pic 1, you will see a list of all the advanced segments. From this list, you can select the segment or segments you want to turn on. Then click on the Apply button.

    Import from Gallery

    At times, it may so happen that you might not be ready to create your own custom advanced segment in which case you have the option to import a segment using the Import from Gallery button as shown in Pic 7.

    image 7(Pic 7)

    Upon clicking the Import from Gallery button, you get all the ready-to-use segments displayed to you as shown in Pic 8 from which you can choose the segment you wish to use.

    Advanced-analytics-segment-8

    Conclusion

    The ways in which Advanced Segments can be harnessed to gather more information about your website traffic are virtually limitless. For example, you can learn about how much traffic you are getting from social media networks and search engines using custom advanced segments. You can also acquire demographic data about website visitors to the different pages on your website.

    Let us just say that the more you use Advanced Segments, the more stuff you will learn about segments as well as about your website traffic.

    Previous Post: Must know mobile advertising trends

  • Universal Analytics v/s Classic Analytics

    Universal Analytics v/s Classic Analytics

    Universal Analytics versus  Classic AnalyticsAs a website owner, you must have signed up for Google Analytics which helps you understand the performance of your website and what your customers are doing on your website. With changing search parameters, Google has rolled out some major analytics changes that enable you to get a holistic view of the user activity and site performance.

    In a recent launch, Google’s Universal Analytics is power packed with some fantastic features which help website or business owners understand how visitors interact to their websites. In fact, Universal Analytics includes a change in the way metrics are collected as compared to Classic Analytics.

    On comparing Universal Analytics with the Classic Analytics, you will find that there are several common features. Basic GA features such as the visitor acquisition, behavior, and conversion data are available in both Universal Analytics as well as in Classic Analytics. You will also find that both the versions have event tracking and AdWords account linking.

    The features which distinguish Universal Analytics from Classic Analytics –

    • Custom Dimensions And Metrics
    • Online/Offline Data Sync
    • Multi-Platform Tracking
    • Simplified Configuration Controls

    At the same time, some advanced advertisement tools not included in Universal Analytics include AdSense, Content Experiments, Remarketing and DFA.

    Key Highlight of Universal Analytics –

    • The newly introduced, analytics.jscode snippet is used to collect data from your website. This biggest advantage of JavaScript is that it is more flexible than its predecessor—Google Analytics ga.js JavaScript.
    •  The tracking code offered allows you to collect data using any digital device. Taking this further –
    • Track websites – analytics.js JavaScript library
    • Track Mobile Apps – Google Analytics SDKs (v2.x or higher)
    • Track other digital devices such as game consoles & information kiosks – the Measurement Protocol
    • Easy to set up and customize tracking code which assists in cross domain tracking in the most accurate manner.
    • Through the account Admin page, you can control organic search parameters, referral exclusions and even search time exclusions.

    Also, Universal Analytics allows creation of custom metrics in an easy to understand and create manner as compared to the procedure in Classic Analytics which some of the webmasters found cumbersome and difficult to do.  This goes a long way in providing key insights to the website and its performance in a much better way.

    LogicSpeak:

    You will have to decide if you want to remain with legacy methods or adapt to the changing world with newer methods. Taking the right decision in business is very important and you will have to make sure that you always take an informed decision.